
Real Estate For Sale In
Louisburg, KS
Welcome to ez Home Search, your trusted source for finding the perfect property in Louisburg, KS.
Explore 64 houses, condos, townhomes, and more, each featuring detailed descriptions
and high-quality images. Find one you like and we can help answer any questions and schedule a tour.
Our innovative tools, including personalized property value estimates and finance calculators, empower
you to make informed decisions. Create your free account today to unlock exclusive features and receive
instant updates on new listings.
Explore all real estate and properties for sale in KS.
64
Available Listings
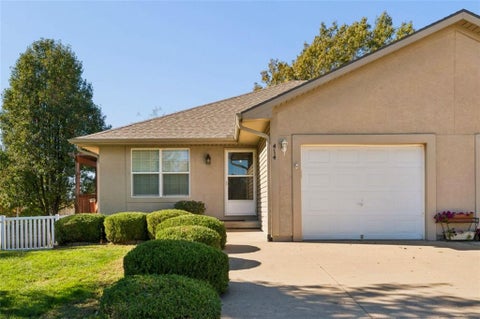
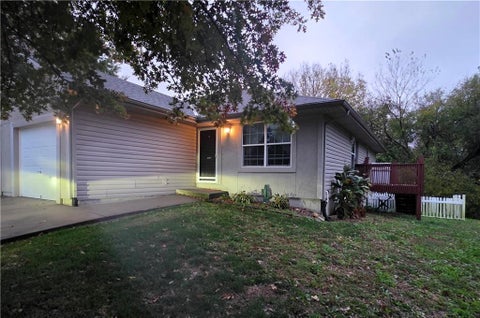
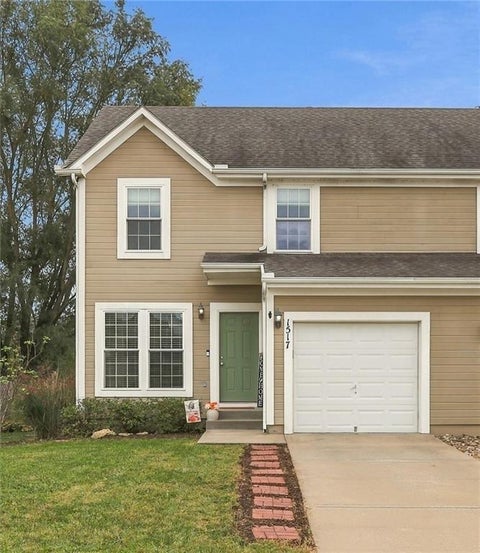
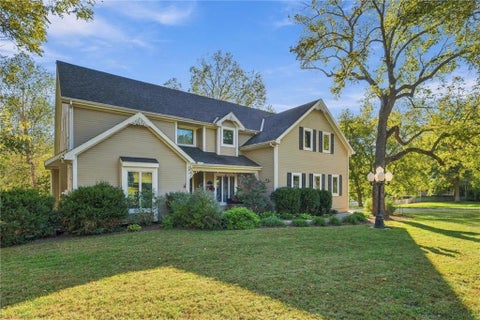
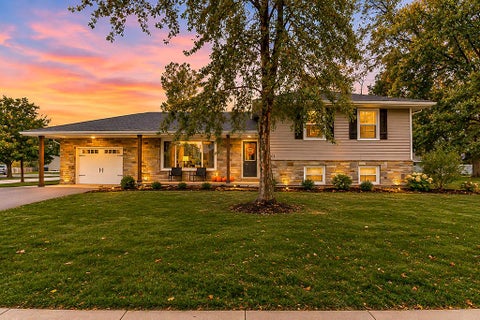
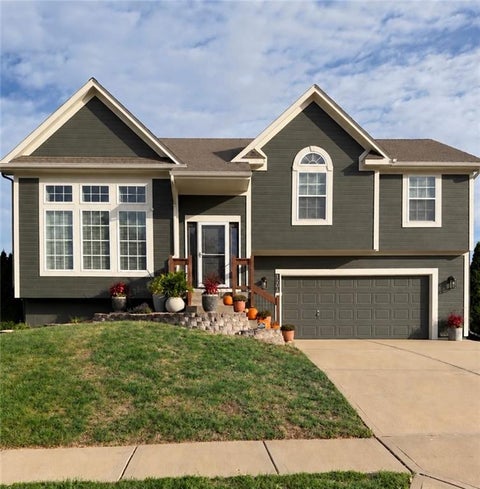
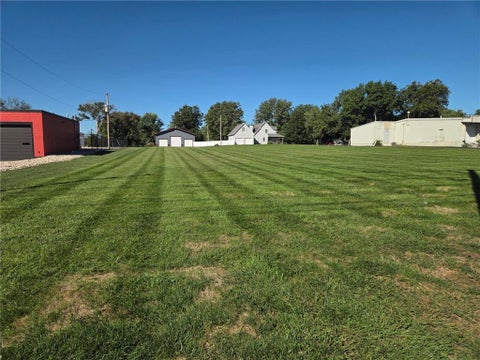
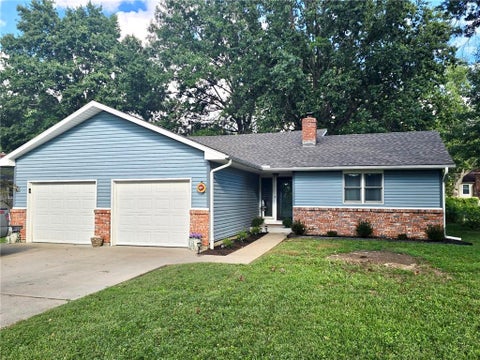
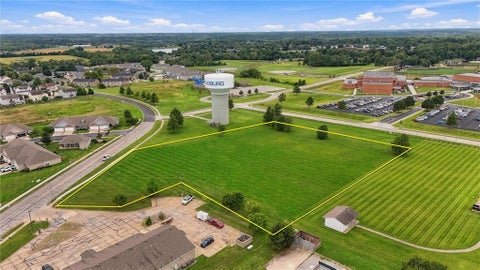
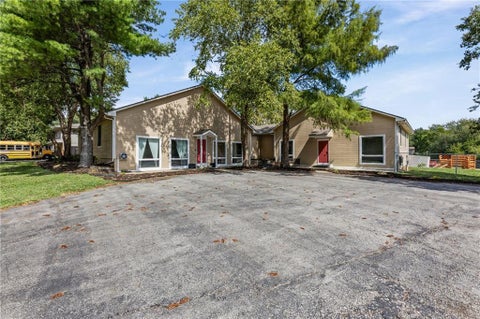
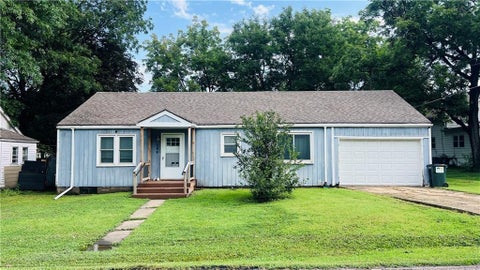

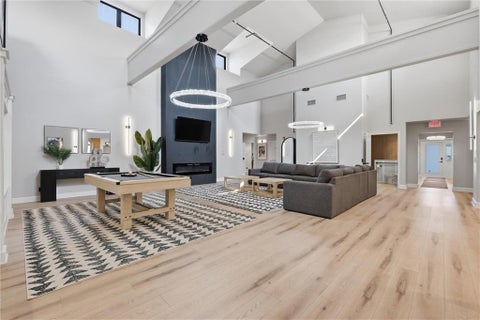
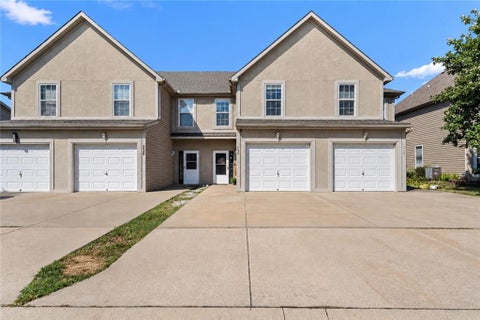
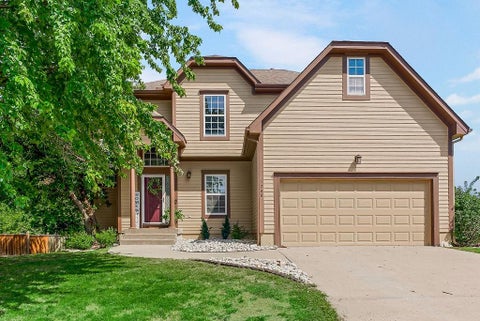
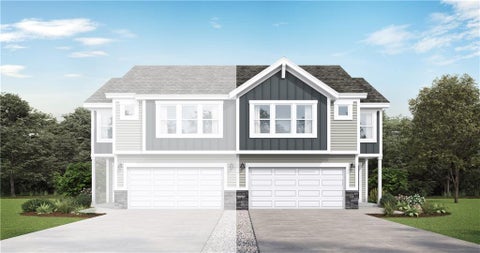
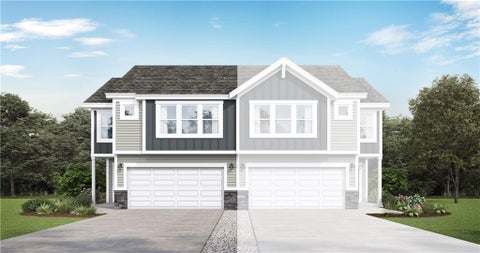
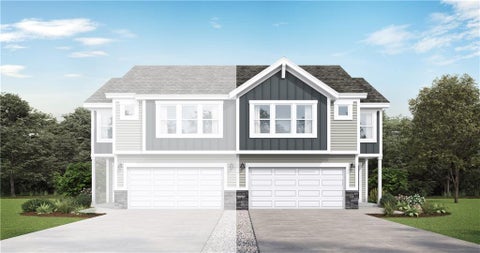
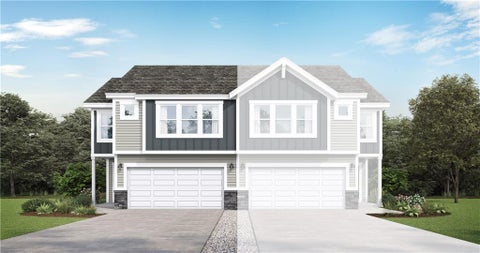
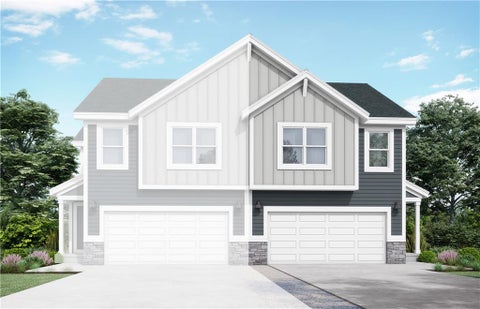
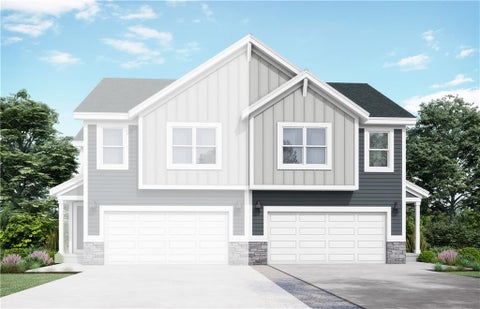
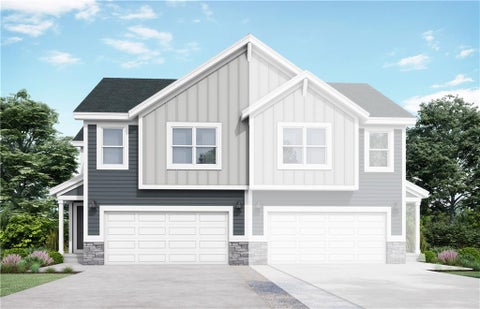
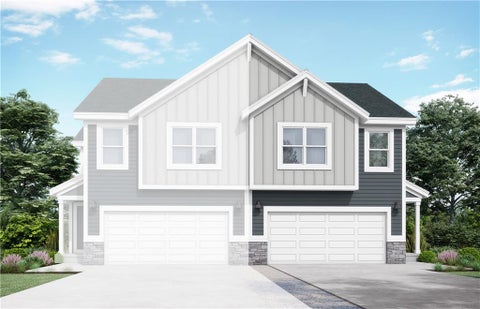
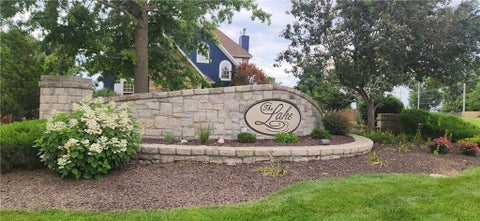
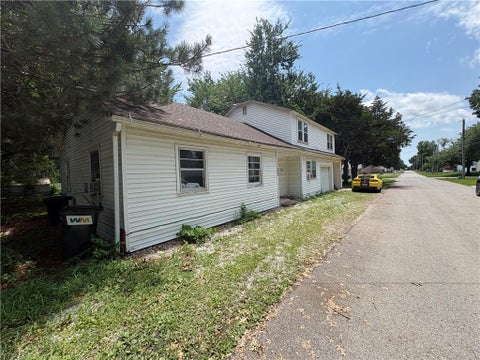
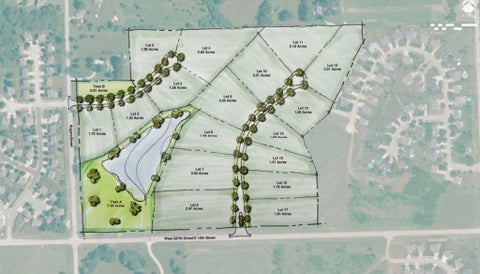
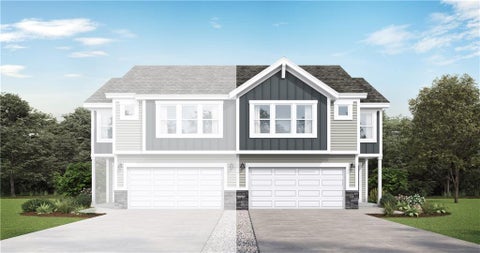
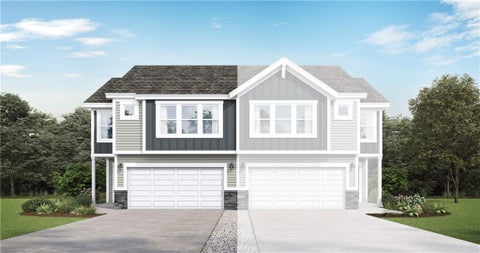
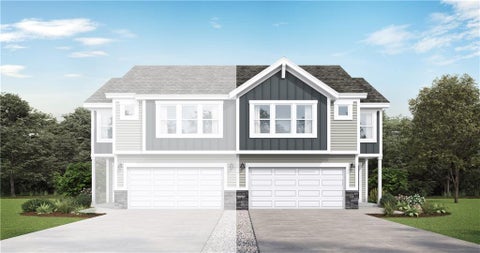
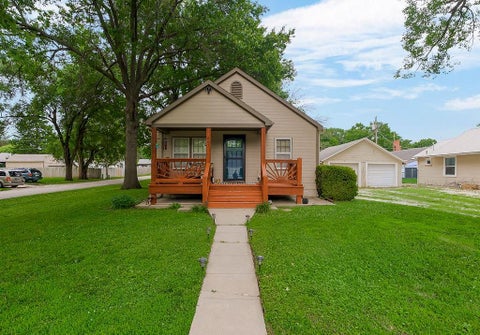
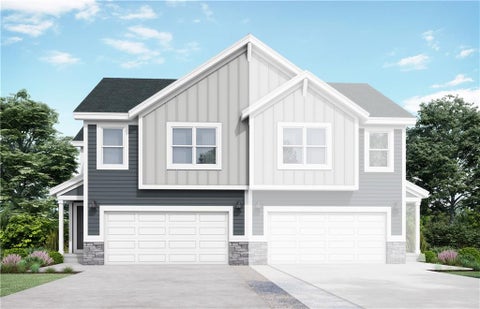
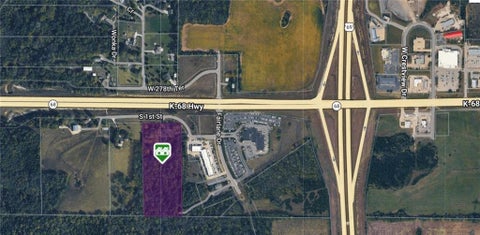
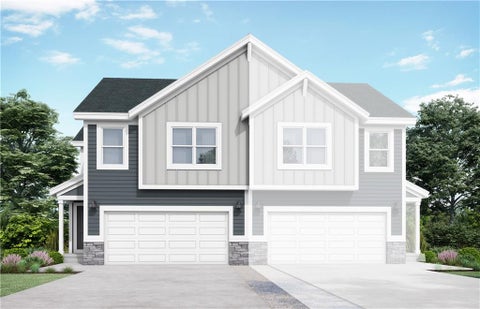
Browse our selection of 64 properties for sale in Louisburg, KS. Our curated catalog features the latest listings, and our website provides you with all the resources you need to make an informed purchase decision. You will find high-quality property photos, detailed listing descriptions, 3D tours, maps, and relevant community information.
As you delve into the detailed listings, you can save your favorite properties for sale in Louisburg, KS, review their latest estimated valuation, and use our mortgage calculator to project monthly mortgage payments, taxes, fees, and insurance. Have a question about a property or the area? Simply ask a question, and our vetted local partner will get back to you.
For personalized financing options and info, complete our contact form to speak with a lender about your financing options, get pre-qualified for a mortgage, or get more information about what is possible.
But why stop at virtual browsing? Schedule an in-person or video-chat tour with a local agent to see your potential new property in Louisburg, KS firsthand. Contact a professional real estate agent for further details, inquire about a property's availability, or express your interest in making an offer.
Properties For Sale in Louisburg, KS: Market Trends
In Louisburg, KS, the real estate market currently features 10 properties for sale. Additionally, 2 properties are under contract and poised to close soon. The recent sales data shows that property sales in Louisburg, KS have an average sale price of $202,305 and an average cost per square foot of $106. On average, properties in Louisburg, KS typically spend about 84 days on the market before being sold.
The real estate market in Louisburg, KS presents a wide array of pricing options, ranging from the most budget-friendly property for sale in Louisburg, KS priced at $0 to the highest-valued residence listed for $0. This variety caters to buyers with different financial situations and preferences, ensuring everyone can find a property that meets their needs.
Louisburg, KS Market Snapshot
Active Listings
64
Pending Sales
2
Average Sale Price
$202,305
Average Price Per Sq. Ft.
$106
Days on the Market
84
Last year's property sales
89
Months of supply
0.13
Real Estate For Sale in Louisburg, KS: Summary/Overview
Find your dream property in the heart of Louisburg, KS. ez Home Search updates listings every minute to give you a wide array of properties across Miami County, spanning 5 distinct zip codes.
Prospective buyers in the Louisburg, KS real estate market have various options to suit their various preferences, from construction date and square footage to lot size, design, and the number of stories. Properties in Louisburg, KS vary widely in construction date, ranging from as early as 1923 to as recent as 2026, with the majority constructed in 2026. Property sizes also vary considerably, from compact units starting at 0 Sq Ft to spacious estates reaching up to 0 Sq Ft.
Lot sizes in Louisburg, KS cater to a broad spectrum of preferences, from manageable plots of 0.0 acres that are perfect for those seeking a low-maintenance lifestyle to large estates spanning up to 0.0 acres, ideal for extensive outdoor activities and ambitious landscaping projects.
The architectural styles and structural designs in Louisburg, KS are equally varied, with Traditional being the predominant style across 32 listings. In terms of structure, most properties are 2.0 story properties featured in 64 properties for sale.
For those considering the financial aspects of homeownership, the range of Homeowners' Association (HOA) fees in Louisburg, KS varies from $0.0 to $0.0, with 30 properties exempt from these fees. This comprehensive range ensures that prospective buyers like yourself can find a property for sale that fits their lifestyle and budget in Louisburg, KS.
Frequently Asked Questions
How many properties are for sale in Louisburg, KS?
There are 64 properties for sale in Louisburg, KS. More active properties usually means better selection and a little more time to compare before you offer.
What is the median list price of properties in Louisburg, KS?
The median list price is $298,395. Median is a clearer "typical" price than average because extreme outliers—like a few luxury estates at the top or a few short sales/fixers at steep discounts—don't pull it up or down as much.
What is the average list price of properties in Louisburg, KS?
The average list price is $311,399. Compare average vs. median to read the market's "tilt": when average is higher than median, upper-end properties are likely lifting the market; when average is lower than median, more lower-priced or discounted properties may be in the mix. A big gap in either direction usually means the current inventory is skewed.
What is the median price per square foot for properties in Louisburg, KS?
Properties list at a median $162 per sq ft in Louisburg, KS. Price-per-foot helps you compare value across neighborhoods and renovations; newer or recently updated properties often sit above the median.
How long do properties typically stay on the market in Louisburg, KS?
The median days on market (DOM) is 60 days. Shorter DOM signals stronger demand—expect quicker tours and faster decisions when DOM is low; longer DOM often means you can compare more and negotiate.
What is the housing months of supply for properties in Louisburg, KS?
Months of supply (MOS) is 4.4. MOS estimates how long it would take to sell all current listings at the recent sales pace if no new properties were listed. As a rule of thumb, 3–6 MOS is balanced; below 3 tends to favor sellers (move fast, expect competition), while above 6 can give buyers more leverage and time.
How many properties sold in the last 12 months in Louisburg, KS?
89 properties sold over the last 12 months. Viewed together with MOS, this gives you a clear read on demand versus supply and helps your ez Home Search partner agent guide you to the best options and strategy.
How many new property listings came on the market in the last 7 and 30 days in Louisburg, KS?
1 new listings in the past 7 days and 4 in the past 30 days. Frequent new listings mean fresh choices appear often; slower weeks suggest acting quickly when the right property appears.
How many property listings had a price reduction in the last 30 days in Louisburg, KS?
4 listings reduced price in the last 30 days. Price cuts can signal sellers aligning to demand—use them to spot improving values or timing for offers.
Is it more or less expensive to live in Louisburg, KS compared with the U.S. average?
Living in Louisburg, KS indexes at 229 versus a U.S. baseline of 100 = 100. Above 100 means higher-than-average costs; below 100 means lower—handy context for your monthly budget.
What is the median property size for properties for sale in Louisburg, KS?
The median interior size is 1,801 sq ft. This tells you the "typical" amount of living space you'll see at common price points, which helps you set expectations for rooms and layout before touring.
What is the median lot size for properties for sale in Louisburg, KS?
The median lot size is 0.23 acres. Closer-in neighborhoods usually have smaller lots; farther out you'll often find more land—compare lot size alongside price-per-foot to balance yard space and interior space.
How many one-story vs. two-story properties are for sale in Louisburg, KS?
About 29% one-story, 71% two-story, and 0% three-plus-story properties are active. Single-story properties are often in tighter supply and attract buyers who want fewer stairs, which can lead to quicker sales and firmer pricing when demand is strong.
What is the median year built for properties for sale in Louisburg, KS?
The median year built among active properties is 2026. Newer properties typically offer modern systems and energy efficiency; older properties may offer larger lots and classic details, though some may need updates—factor both into your budget and timeline.
Which neighborhoods currently have the most properties for sale in Louisburg, KS?
You'll find the most active properties for sale in the Starbrooke, Louisburg, City Of Louisburg, Summerfield Farm, Countryside East communities. Starting your search there usually gives you more options in a single tour.
What is the typical monthly HOA for properties for sale in Louisburg, KS?
The median HOA is $39 per month (where applicable). HOA dues affect your monthly affordability and loan qualification—use our mortgage calculator to see the full picture.
How much do you need to make to afford a property in Louisburg, KS?
The median property price in Louisburg, KS is $298,395. With a 20% down payment ($59,679) and a 30-year fixed at 7.0%, the estimated principal-and-interest (P&I) payment is $1,588/month (plus property taxes, homeowners insurance, HOA dues, PMI if required, and utilities). Based on the 28/36 guideline for housing costs—where total housing expenses should be about 28% to 36% of your gross income—you'd want a household income of roughly $68,065 to $52,939 per year. Use our pre-approval form to know exactly what you qualify for and to be able to make a stronger offer.
How are the schools near properties for sale in Louisburg, KS?
Many properties in Louisburg, KS are served by well-rated public and private schools; check each listing's school panel for boundary notes and current ratings, then compare nearby options as you narrow neighborhoods.
HOA Monthly Fees of Properties for Sale
Construction Dates of Properties for Sale
Square Footage of Properties for Sale
Lot Sizes of Properties for Sale
Number of Stories of Properties for Sale
HOA Monthly Fees of Properties for Sale
Properties For Sale in Louisburg, KS: Basic Features
Discover the essential features of properties for sale in Louisburg, KS with our detailed listings. Whatever your preferences in size or style, each property offers a range of foundational amenities to enhance your living experience.
Sewer
Public
34
Private
0
Basement
ADA Accessible
Yes
0
No
64
Properties For Sale in Louisburg, KS: Interior Features
Bedroom Count of Properties for Sale in Louisburg, KS
Bathroom Count of Properties for Sale in Louisburg, KS
Properties with Fireplaces in Louisburg, KS
Homes with 1 fireplace
3
Homes with 2 fireplaces
0
Homes with 3+ fireplaces
1
Homes with no fireplaces
0
Popular Flooring in Louisburg, KS
Popular Security Features in Louisburg, KS
Properties For Sale in Louisburg, KS: Exterior Features
Properties with a pool in Louisburg, KS
Popular Roof Types in Louisburg, KS
Metal
0
Wood
0
Concrete
0
Tiles
0
Slate Roofing
0
Asphalt Shingle
0
Composite Material
35
Membrane Roofing
0
Shingles
0
Waterfront Properties in Louisburg, KS
Patio and Porch Features of Properties for Sale in Louisburg, KS
Garage Spaces of Properties for Sale in Louisburg, KS
Properties For Sale in Louisburg, KS: Listing Overview
Louisburg, KS Properties Listing Overview
Active Properties Listings in Louisburg, KS
64
Properties Listings Under Contract in Louisburg, KS
2
Price-Reduced Properties Listings in Louisburg, KS
2
Recently Sold Properties in Louisburg, KS
89
Real Estate For Sale in Louisburg, KS: Demographic Data
Family Composition in Louisburg, KS
Families with children
25.6%
Families without children
37.47%
Gender in Louisburg, KS
Male
48.88%
Female
51.12%
Population by Age in Louisburg, KS
Under 18
26.520000000000003%
18-64
53.9%
65 and over
19.57%
Marital Status by Gender in Louisburg, KS
Never Married
Male 32.61% / Female 18.36%
Now Married
Male 60.31% / Female 61.42%
Divorced
Male 7.04% / Female 12.48%
Widowed
Male 0.04% / Female 7.75%
Occupied VS. Vacant Units in Louisburg, KS
Occupied
1576
Vacant
44
Ownership of Occupied Units in Louisburg, KS
Owner Occupied
1073
Renter Occupied
503
Population by Education Level in Louisburg, KS
No Degree
46.22%
Some High School
2.47%
High School
29.88%
Some College
23.44%
Associates
11.24%
Bachelors
23.39%
Post-grad
18.2%
Population of Veterans in Louisburg, KS
Veterans
8.25%
Create an account today to unlock benefits like:
- Saving your favorite homes for sale in Louisburg, KS.
- Email Louisburg, KS home listings to your friends and family.
- Set up a saved search to receive email alerts for new listings in Louisburg, KS.
Based on information submitted to the MLS GRID as of November 11, 2026 at 03:56PM. All data is obtained from various sources and may not have been verified by broker or MLS GRID. Supplied Open House Information is subject to change without notice. All information should be independently reviewed and verified for accuracy. Properties may or may not be listed by the office/agent presenting the information.
Copyright 2026, Heartland MLS. All rights reserved.
Last Updated: November 11, 2026 at 03:56PM | Source: Heartland MLS | MLS#: %mlsId%

Nearby Real Estate
Nearby Zip Codes
Louisburg Neighborhoods
Louisburg, KS Property Types