Housing Affordability Tanks Shows New Data
People are still buying homes, even as mortgage rates reach near 8% and median home prices continue year-over-year appreciation. But what and how they’re buying is taking a major hit, shows the latest data analysis on Federal Reserve and housing market data.
If you’re in the market to buy a home, this news isn’t a surprise. Prior number-crunching examples have demonstrated how higher interest rates alone have increased monthly mortgage payments by hundreds, if not thousands, for the same mortgage two years ago.
According to Lawrence Yun, the Chief Economist for the National Association of Realtors (NAR), the monthly mortgage payment for a typical home in late 2020 was around $1,100. Now it’s twice that.
Buying power slashed in half
A home buyer’s purchasing power simply doesn’t stretch as far as it did pre-pandemic. Now the data from the Federal Reserve of St. Louis demonstrates how much: about 50% as far.
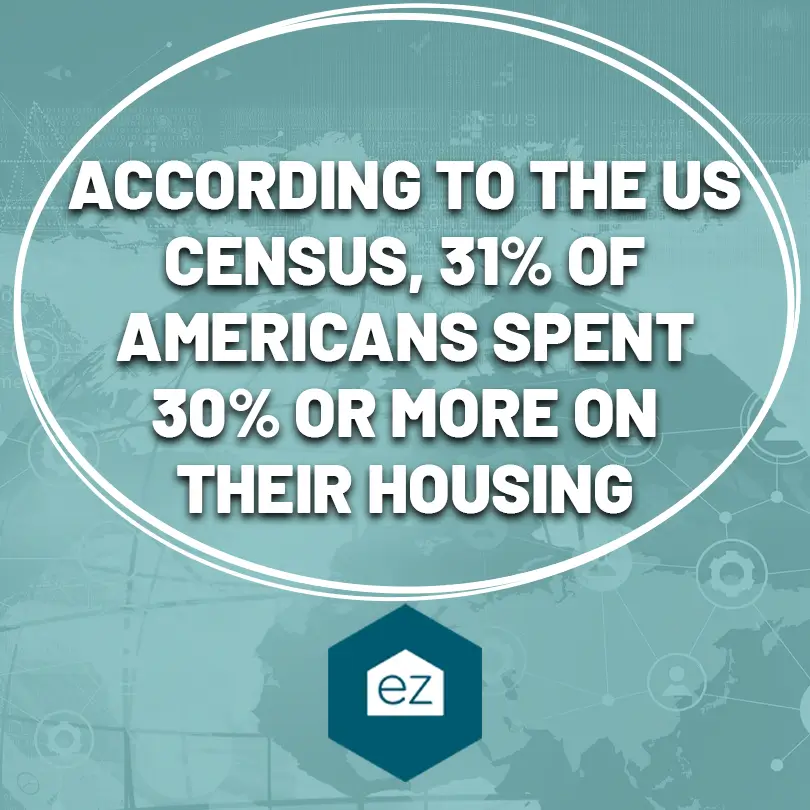
The nationwide median list price is now above what the median household income can afford. Affordability is defined as not spending more than 30% of a household’s income on housing costs (not including utilities or insurance).
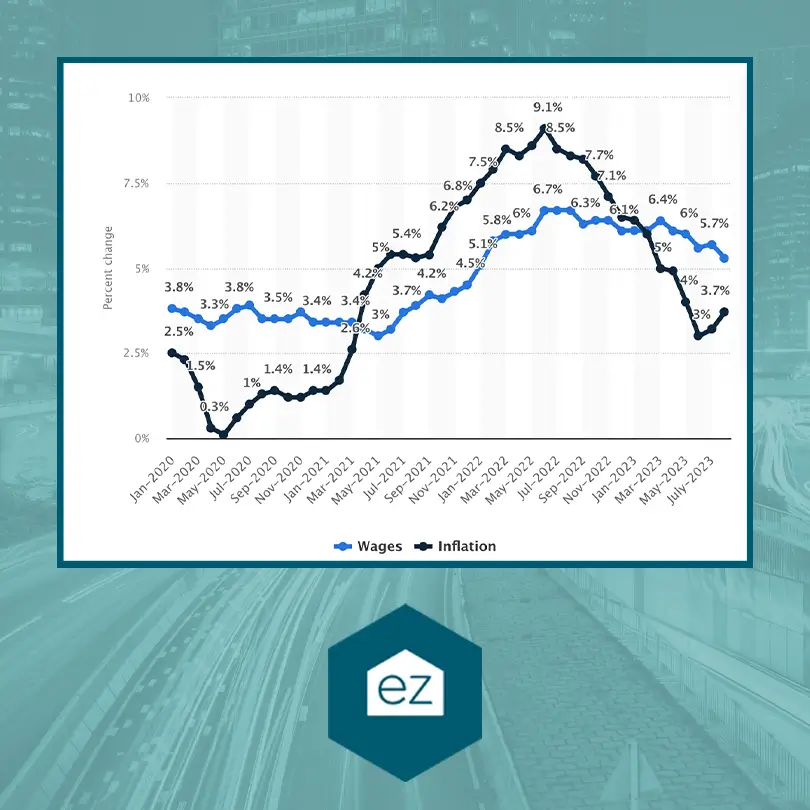
Mortgage rates at their two-decade high are not the only problem, though. It’s the combination of inflation, stagnant wage growth, price appreciation, and high interest rates that is significantly stressing housing affordability.
Household incomes lagging behind
To put things into perspective, the NAR has calculated that in order to afford a median home today, you would need to earn $107,232 per year. This calculation takes into account current rates, a 20% down payment, and conservatively spending 25% of your gross monthly income on housing expenses.
Compare that to the reported median household income of $74,580 by the US Census Bureau in 2022. While the income numbers for 2023 aren’t available yet, it already suggests most households aren’t making enough income to buy a middle-of-the-road home.
Back in September 2021, the income needed to buy a median-priced home was $44,205.
Wage growth was well behind inflation rates from mid-2021 until February of this year. Things have turned around, though. In August 2023, wages grew 5.3% while inflation was 3.7%. But wage growth simply hasn’t had time or runway yet to catch up with the months of inflation’s ripple effects.
Housing index shows disparity
In another measure of housing affordability, the NAR Housing Affordability Index measures the ability of individuals with median incomes to purchase a home. It has dropped from a typical reading of 120 to a staggering low of 91.7 in August 2023. This marks the lowest reading since October 1985.
So what gives? It’s a combination of factors we’ve mentioned below: high mortgage rates are encouraging owners to not sell, reducing the available inventory of homes for sale. That puts pressure on the prices. Meanwhile, high interest rates are also discouraging buyers and shrinking the buyer pool.
The housing shortage roots go back to the Great Recession of 2006-2008, when home builders scaled back on construction. That market hasn’t kept pace with demand for years, further exacerbating the low inventory of homes.
Changing housing affordability will take pulling on multiple levers. Wage growth needs to accelerate to increase household buying power. More homes are needed on the market, probably as a combination of new construction and existing homes. And high interest rates need to stabilize to increase buyer confidence and keep monthly payments manageable for those who finance their homes.
It’s important to stay informed about these changes in the housing market, so if you’re considering buying a home, make sure to keep these numbers in mind!
Start Your Home Search
Preston Guyton
Share this Post
Related Articles
Real Estate News
New Laws Taken Action On Rising Squatting Reports
Real Estate News
White House Proposals Aim to Boost Housing Supply
Real Estate News
NAR Settlement Set to Reshape The Business of Real Estate
Real Estate News
