8 Housing Markets To Score a Deal

A good rule of thumb for homeowners is to spend no more than 30% of their gross income on their housing. For instance, if you earn $5,000 a month, $1,500 spent on the mortgage payment will likely be reasonable.
But as it turns out, this is more than a handy rule of thumb for personal budgeting. A recent article highlighted how this calculation, when measured against the median incomes of people living in the area, can reveal where homes are undervalued.
How payment-to-income measures housing affordability
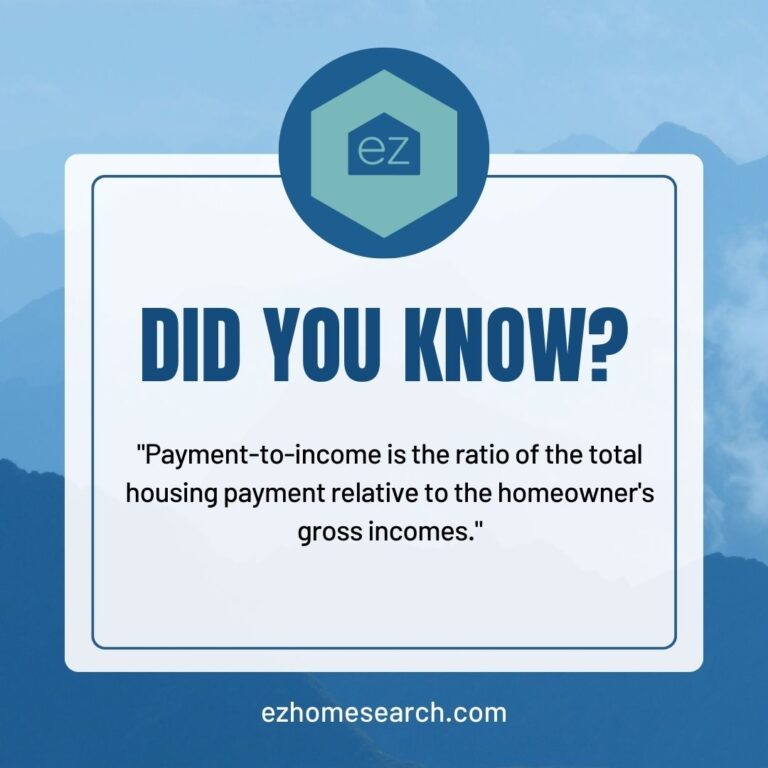
Measuring housing affordability includes numerous factors: mortgage rates, local income, the area’s cost of living, property taxes, and more. But the payment-to-income ratio as a simple indicator can yield some interesting results. Payment-to-income is the ratio of the total housing payment relative to the homeowners’ gross incomes. Most Americans spend about 37% of their income on housing by this measure.
This ratio provides different results than the housing affordability index (HAI). It may help find affordable housing areas that might slip through the statistical cracks.
Spend Less than 20% in Two Markets
Detroit Metro
Top on the list was the Dearborn-Warren-Detroit metropolitan area of southeast Michigan, with a payment-to-income ratio of 17.4%. Said another way, someone earning $10,000 a month gross could expect to pay about $1,740 monthly towards their home. That means plenty of wiggle room in the Detroit area.
It’s worth noting that this is a broad measure that doesn’t always reflect true housing affordability for lower-income residents. As the Chicago Fed notes, the average monthly rent in Detroit is affordable to 60%, earning above the area median income, but 56% of the city’s renters earn 50% or less of the area median income. Though the overall picture is rosy, affordability will depend on your income in the Detroit metro.
Cleveland metro
Next on the list wasn’t too far off geographically or by the numbers. The Cleveland metro in Ohio had a payment-to-income ratio of 18.9%. It was the only other area under 20% on the list. It suggests a high degree of housing affordability for Cleveland area homes, even if it followed the larger national trend of increasing home prices. That gives average-earning workers substantial opportunities to find homes in Cleveland and surrounding areas.
Midwest shines for affordability
The following metropolitan areas rounded out the numbers:
- St. Louis: 21.7%
- Philadelphia-Camden-Wilmington: 22.3%
- Cincinnati: 23.6%
- Chicago-Naperville-Elgin: 24.4%
- Indianapolis-Carmel-Anderson: 24.6%
- Oklahoma City: 25.4%
- Omaha-Council Bluffs: 25.9%
- Kansas City: 28.2%
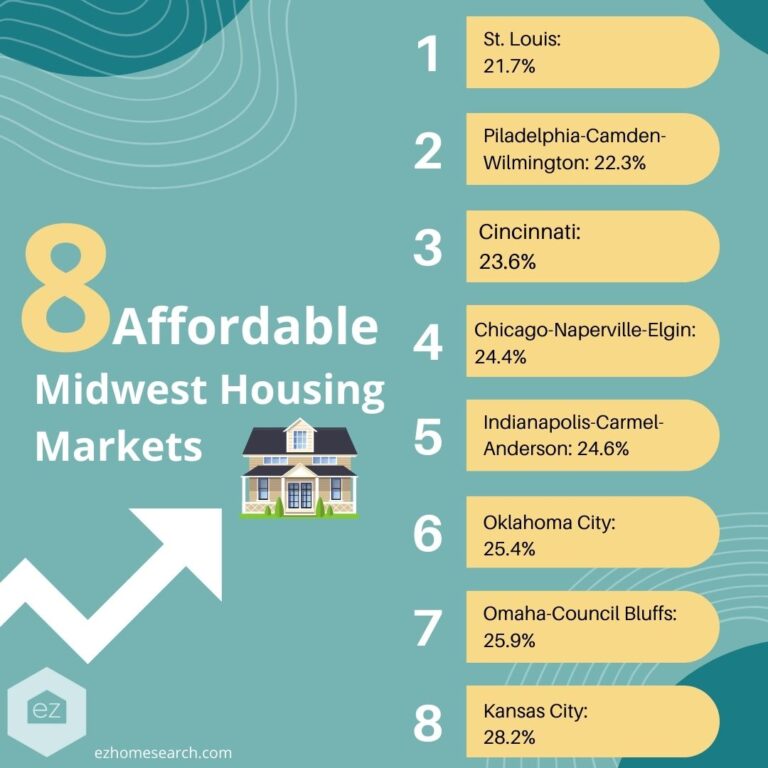
Noticing a pattern? With one or two exceptions, home affordability, as ranked by payment-to-income, is high across the Midwest. If you’re looking for opportunities to keep more of your earnings in your payment without having to put too much towards housing, the American Midwest is currently the place to be.
Measuring housing affordability by other standards
The payment-to-income ratio is a fast and easy calculation, but it’s not a hard science. Other factors go into home affordability. Maybe one market tends to have smaller, modestly-priced homes than another. Maybe another has a thriving job market with more high-income jobs and low-priced homes.
Using different measurements shifts exceptional housing affordability to regions beyond the Midwest. For example, the most affordable cities and towns for first-time homeowners saw a top ten filled with the Southeast and the Mountain West. Florida alone had four metropolitan areas on the list, with Cape Coral-Fort Myers performing the best from the Sunshine State. Overall, the lowest-priced homes on the list belonged to McAllen-Edinburg, Texas.
What if we want to find the areas with higher living costs? These may be the regions home buyers avoid.
For that, turn to the housing affordability index released by the National Association of Realtors, with first-quarter results for 2023. They ranked housing markets by the highest median sales numbers.
The highest-cost houses belonged to the San Jose, CA area, the heart of Silicon Valley. There, high incomes and high demand combine to drive up real estate prices, which is why median home prices entered seven digits. Two other California areas had similar results–Anaheim and San Francisco/Oakland–with Honolulu, Hawaii rounding out the top four.
What the data says about undervalued homes
Undervalued homes can be found across the country, depending on how you slice the data. That’s encouraging when mortgage rates remain high, and housing affordability remains challenged. Using different metrics (like income-to-payment ratios) is a great way to play around with the numbers and find hidden gems, particularly if you don’t see any areas near you on the list of the most undervalued home markets.
Home affordability will always be a mix of a few variables. Home prices are one thing. But job opportunities, the cost of living, and local incomes will also significantly affect how affordable a home might be. If you can find low home prices relative to high incomes, you might have a recipe for a diamond in the rough.
Start Your Home Search
Preston Guyton
Share this Post
Related Articles