2023 in Real Estate: Home Sales Reach Multi-Decade Lows
Now that the US housing market statistics are out, the picture reflects home buyers’ economic uncertainty throughout 2023. Nationwide existing home sales data demonstrates that while buyers wanted to buy, many delayed making that decision. Sustained low inventory is a contributing reason; the decline in housing affordability was even more influential.
Just 4.087 million existing homes sold during 2023, which comes to 20.6% fewer home sales than in 2022. Year-over-year (YOY), nationwide existing home sales hit their lowest levels in 28 years during December 2023.
Home sales slow down in 2023
Sales activity peaked in early 2021 and has waned since, especially over the last year. Looking at monthly home sales figures for 2023, activity dropped the most in January 2023, with a -36.9% decline in closed sales. Every month since then, we have also reported YOY slowdowns, but the change has become less drastic each month. By December 2023, the nation had a 6.2% YOY drop in closed sales. Part of why the home sales activity slowdown became less dramatic throughout the year is the timing; sales activity was already diminishing in the later months of 2022.
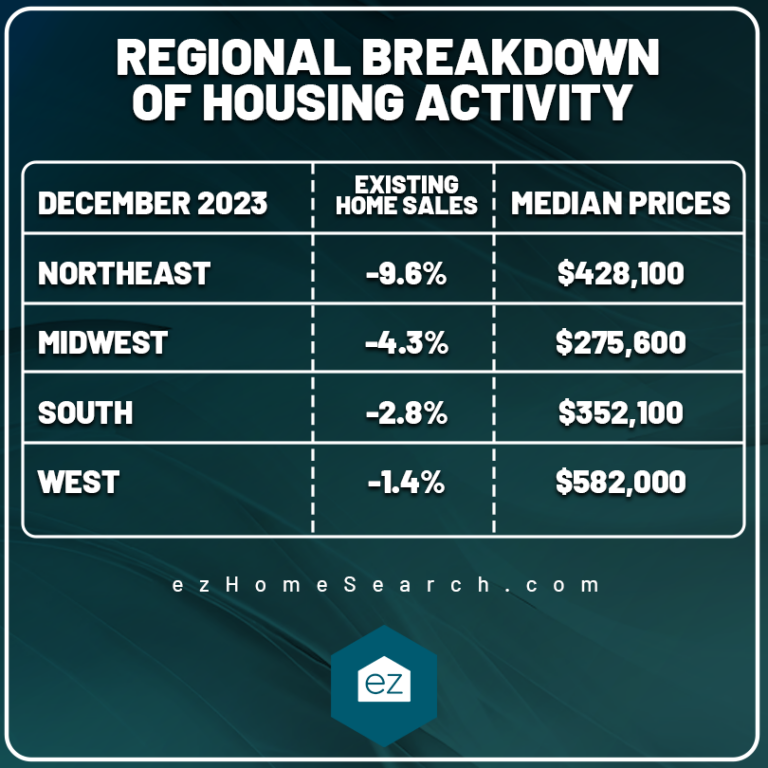
Decreased sales were most pronounced in the South and Midwest while remaining the same in the Northeast and rising in the West.
Even though fewer homes sold, people are still buying, and it’s clear where they want to go. The busiest market for sales activity is the South, which accounted for 46% of the existing home sales.
Home prices kept rising
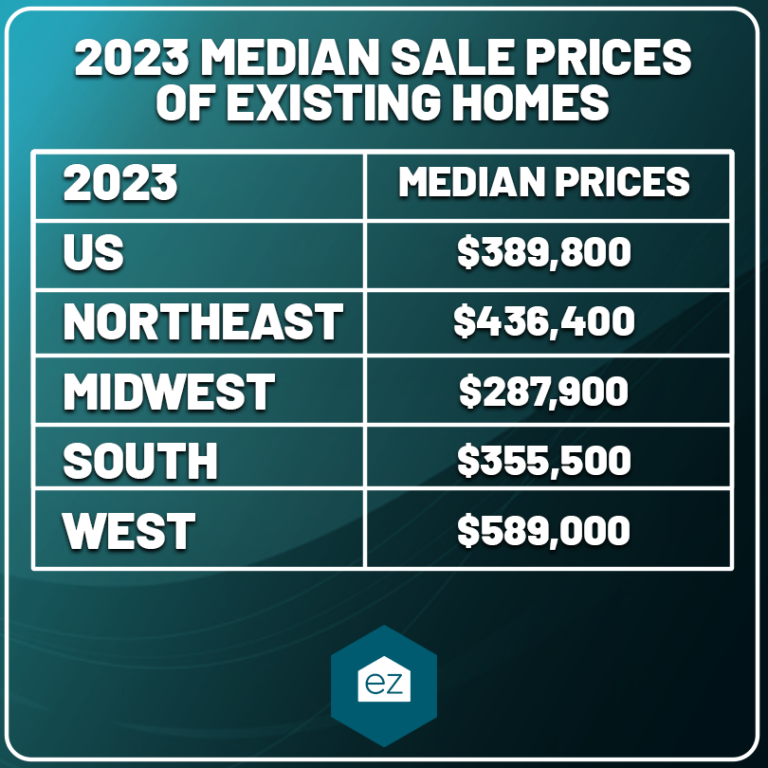
Despite sluggish activity, median prices achieved a new record high of $389,800 for 2023. That accounts for single-family, condos, and townhomes. That figure was a 0.86% increase over the prior year.
For single-family homes, the median price reached $394,600, while condos reported a median of $348,500.
Median price gains were sustained across all four regions. Over the year, nationwide median prices peaked in June 2023 at $410,000 and mostly trended downward from there. Other than from March to June, home prices have reported monthly YOY gains. That and the high mortgage rates caused housing affordability to shrink. It’s a combination that shrank the prospective buyer pool.
Trending towards more inventory
The year ended with a 3.2-month inventory supply, up from 2.9 months in December 2022. Condos had more inventory at 3.5 months, while single-family homes achieved a 3.1-month supply of inventory. Both metrics show homes are staying longer on the market, as the 2022 nationwide supply of inventory was 2.7 months.
Even though homes are not selling as quickly, as of December 2023, they were selling in less than a month–a median of 29 days, to be precise.
National Association of Realtors (NAR) Chief Economist Lawrence Yun foresees a new setup for 2024, as he pointed out how mortgage rates declined in the final two months of 2023. Given the Federal Reserve’s projected change in its policy and a revised economic outlook, more inventory and sales are expected in 2024. Still, don’t expect dramatic increases in housing market sales activity but rather a cautious “reawakening.
Housing regions
The NAR-defined housing market regions are as follows:
Northeast: Pennsylvania, New Jersey, New York, Connecticut, Massachusetts, Maine, Vermont, New Hampshire, Rhode Island
South: Maryland, Delaware, Virginia, West Virginia, Tennessee, Kentucky, North Carolina, South Carolina, Florida, Georgia, Alabama, Louisiana, Mississippi, Texas, Oklahoma, Arkansas,
Midwest: Ohio, Michigan, Wisconsin, Minnesota, Iowa, Illinois, Indiana, Missouri, North Dakota, South Dakota, Nebraska, Kansas,
West: Colorado, New Mexico, Idaho, Wyoming, Montana, Washington, Oregon, California, Nevada, Arizona, Utah, Alaska, Hawaii
- Copyright ©2024 “December Existing Home Sales.” NATIONAL ASSOCIATION OF REALTORS®. All rights reserved. Reprinted with permission. January 22, 2024, https://www.nar.realtor/newsroom/existing-home-sales-slid-1-0-in-december
- Copyright ©2024 “December 2023 Existing Home Sales Statistics.” NATIONAL ASSOCIATION OF REALTORS®. All rights reserved. Reprinted with permission. January 22, 2024, https://cdn.nar.realtor/sites/default/files/documents/ehs-12-2023-summary-2023-01-19.pdf?_gl=1*hccck5*_gcl_au*Nzk3NDQwMjM5LjE3MDU0MTAxNDI
- Copyright ©2024 “2023 Existing Home Sales Overview.” NATIONAL ASSOCIATION OF REALTORS®. All rights reserved. Reprinted with permission. January 22, 2024 https://cdn.nar.realtor/sites/default/files/documents/ehs-12-2023-overview-2023-01-19.pdf?_gl=1*1yc66zi*_gcl_au*Nzk3NDQwMjM5LjE3MDU0MTAxNDI
Start Your Home Search
Preston Guyton
Share this Post
Related Articles
Real Estate News
New Laws Taken Action On Rising Squatting Reports
Real Estate News
White House Proposals Aim to Boost Housing Supply
Real Estate News
NAR Settlement Set to Reshape The Business of Real Estate
Real Estate News
