March 2023 Monthly National Real Estate Report: Home Sales Down
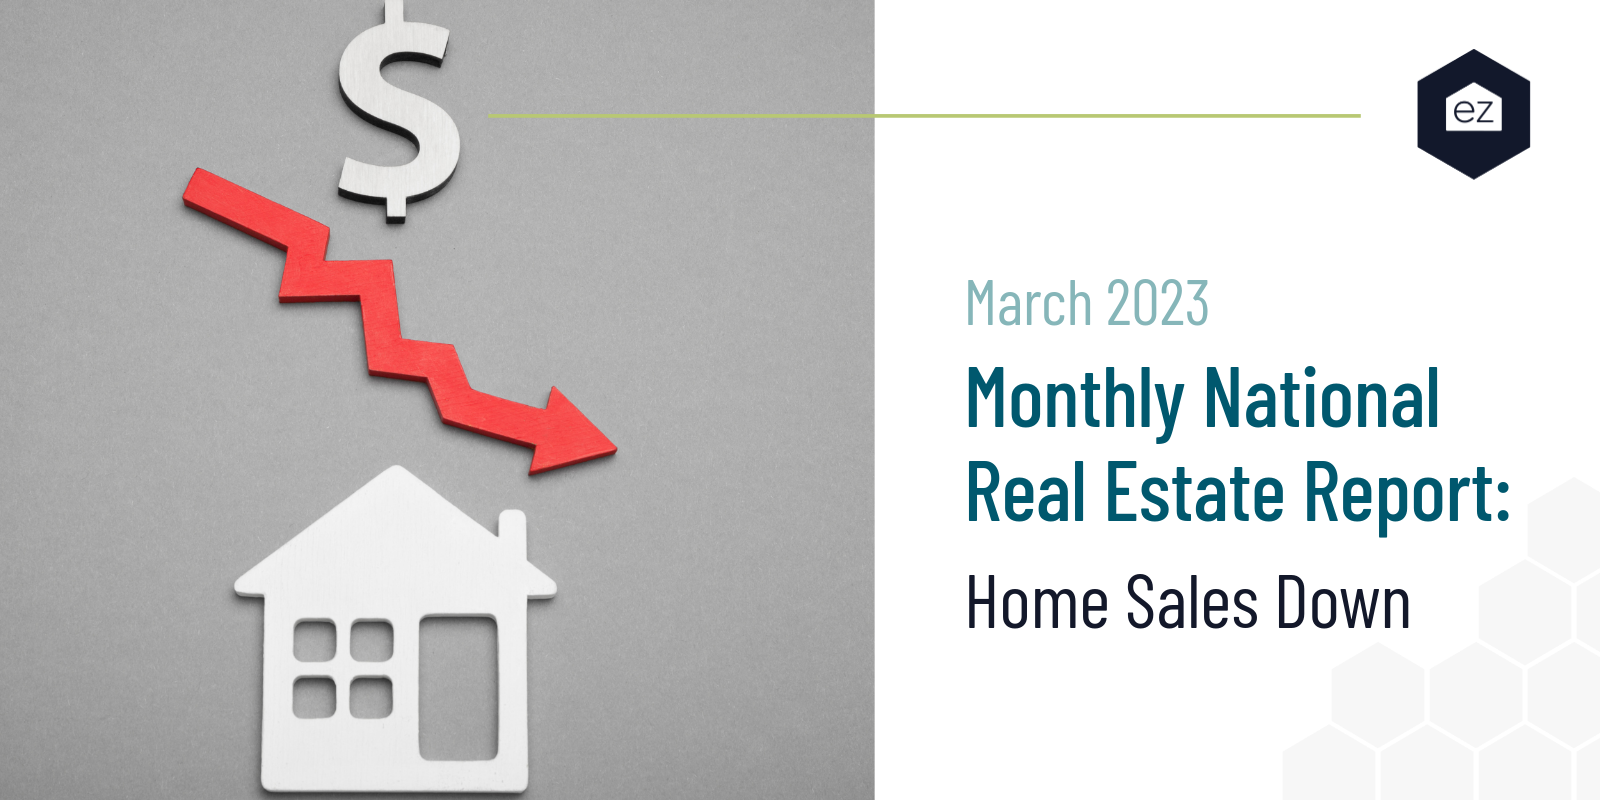
March 2023 Monthly National Real Estate Report: Home Sales Down
After months of higher mortgage rates and housing affordability challenges, the data from the first quarter of 2023 are unsurprising. The National Association of Realtors reports existing home sales fell 2.4% nationwide.
The news hits with a reminder that real estate markets have been a bit challenged due to the quick-rising mortgage rates and inflation of 2022. These ongoing changes persisted through the first three months of the year.
Look closer at the data to see what it says about where the market is heading in spring and summer 2023.
What the Existing Home Sales Data Tells Us
Since existing home sales make up most transactions in the residential real estate market, changes here have a marked impact on the resulting data and sales activity.

A slowdown in existing home sales indicates a slowdown in the overall market, potentially shifting things in favor of buyers rather than sellers. When existing home sales are up, it shows strong demand for existing homes while hinting that people selling existing homes are also moving to new homes.
Existing Home Sales—By the Numbers
While existing home sales dipped only 2.4% between February and March 2023, it helps to contextualize the recent dips. Existing home sales in March declined 22% from where the numbers were a year prior.
The NAR data reports 5,690,000 existing home sales in March 2022, compared to 4,440,000 in March 2023. That includes data from all four major regions, which presents a “total” nationwide number.

Lawrence Yun, NAR Chief Economist, said that this indicates how sensitive home sales can be to changes in mortgage rates. He called it a unique housing market thanks to two factors:
- Demand remains relatively high. One might expect that the demand would start to decline with higher interest rates on home mortgages. That may often be the case, but Yun sees a market where even starter homes see plenty of offers, meaning there must be an imbalance between supply and demand.
- Supply is low. What may be keeping existing home prices high is existing owners with low fixed-rate mortgages don’t want to give them up. Those who purchased a home in 2020 or 2021, when fixed-rate mortgages were near all-time lows, potentially secured a historically low rate for the next thirty years. Many homeowners don’t want to give that up, as moving out of an existing home may require a new mortgage. At current interest rates, that adds thousands to their housing costs over time, not to mention the bump to their monthly mortgage payment even if they bought a similarly priced home.
Additionally, Yun noted that there may not be enough supply to meet demand—for example, this data doesn’t include what happens when there are multiple offers on existing homes.
While existing home sales typically indicate where supply and demand have headed, the current data hints at the reality that many homeowners don’t want to give up their low-interest rates, keeping homes off the market and sustaining the demand.
Existing Home Sales in the South
What about the regional data? Although the Northeast held strong with improved month-over-month numbers, the three other regions–Midwest, West, and South–reported month-over-month declines. Meanwhile, compared to a year ago, all four parts of the country saw decreases in existing home sales.
According to the NAR data, existing home sales in the Northeast remained stable from month to month, with about 520,000 in February and March 2023. The South wasn’t far off, dropping by about 20,000 existing home sales.
That may seem like a lot, but the total number of existing home sales across the South in March was a seasonally-adjusted 2,070,000, representing a 1% change.
Hottest Markets in March 2023
Though existing home sales dipped in March 2023, that doesn’t mean every market followed the nationwide and even regional trend. Plenty of markets are reporting spikes in existing home sales.
The Market Hotness Index is one indicator of market activity. And though this isn’t a direct overlap with the data from the NAR, there are some interesting things to note:
- Three of the hottest overall markets were in the Northeast, which helps explain why this region performed so well compared to the others. Rochester, NY, Nashua, NH, and Hartford, CT, were all among the hottest in the nation, scoring above 97 on the index each—with the index weighted up to 100.
- The Midwest performed surprisingly well on the index, despite the regional numbers not being as good as the Northeast’s. Particular standouts included Columbus, OH (97.49) and Janesville-Beloit, WI (92.81).
National Median Sale Price Creeping Down

Finally, it’s worth noting that the nationwide average sales price of existing homes based on the NAR data was $375,000, an almost 1% drop from March the prior year. The current market supported about 2.6 months’ worth of inventory. Sales prices were highest out West, at $565,400, a 7.5% year-over-year drop. The Midwest had the most affordable existing homes, with an average of $273,400.
This should provide some context as to which housing markets are seeing higher-than-average existing home prices and show where respective markets fall on this spectrum. Knowing that prices are slowly declining could be good news for home buyers already pinched by maintaining high sale prices for existing real estate.
Copyright ©2023 “Existing Home Sales.” National Association of Realtors. All rights reserved. 2023, https://cdn.nar.realtor/sites/default/files/documents/ehs-03-2023-overview-2023-04-20.pdf.
Start Your Home Search
Preston Guyton
Share this Post
Related Articles
Real Estate News
New Laws Taken Action On Rising Squatting Reports
Real Estate News
White House Proposals Aim to Boost Housing Supply
Real Estate News
NAR Settlement Set to Reshape The Business of Real Estate
Real Estate News
